Candlestick Charts
Candlestick charts are far easier to read and provide more information than a bar, line, P&F, Kagi, or other non-candlestick charts. All trading instruments from option contracts to futures and Forex can use candlestick charting to plot and follow price action and to plan exits and entries. Candlestick Charts provide the most graphical view of what is going on with price. Since every transaction, no matter how small or how large is recorded and documented it is possible to make a precise and highly accurate recording of what price is doing.
They can also be used on indexes, industry indexes, etc. The term “candle” comes from the Japanese who created this form of charting for their rice commodity exchange during the 1600’s. The “candlesticks on the chart look like real candles of that era, hence the name. Although we must modify how we interpret candlestick patterns for our western automated marketplace, these charts are far superior to any other form of charting at this time.

But for most people who are just starting to learn about candlesticks, the task may seem daunting as there are so many different candle patterns all having strange, Japanese names. Then too, most candlestick books offer complicated methods and confusing explanations that can frustrate the average trader.
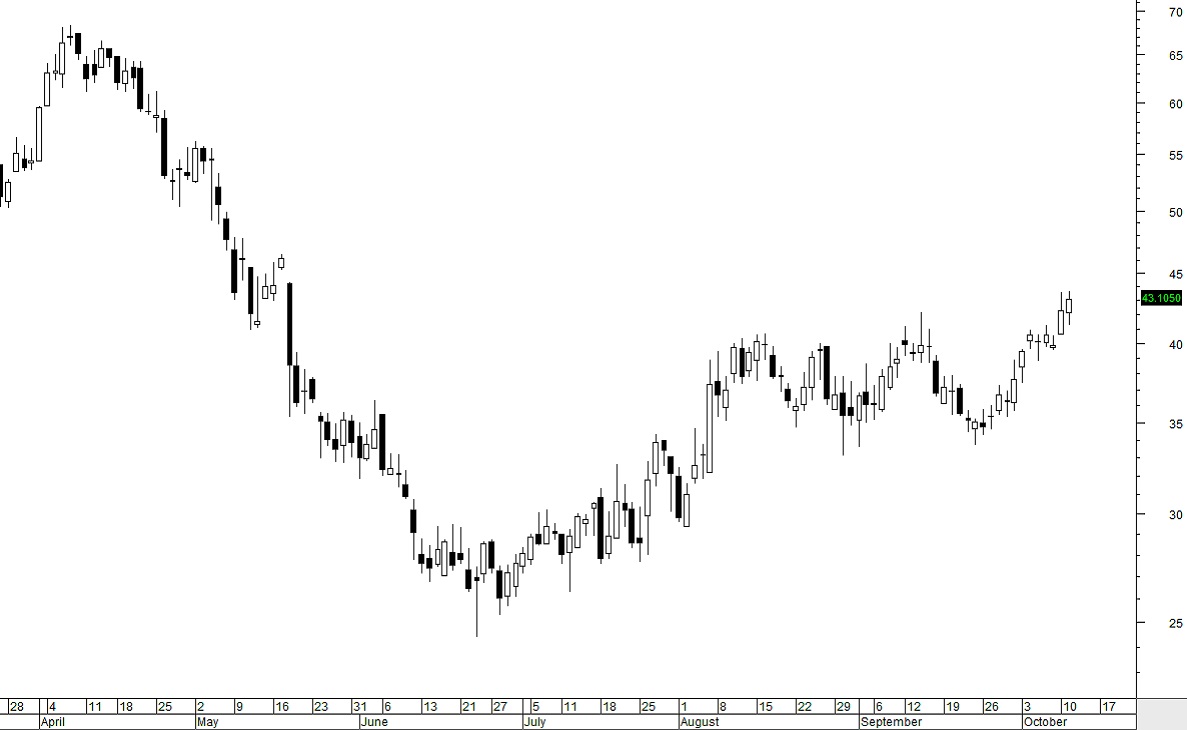
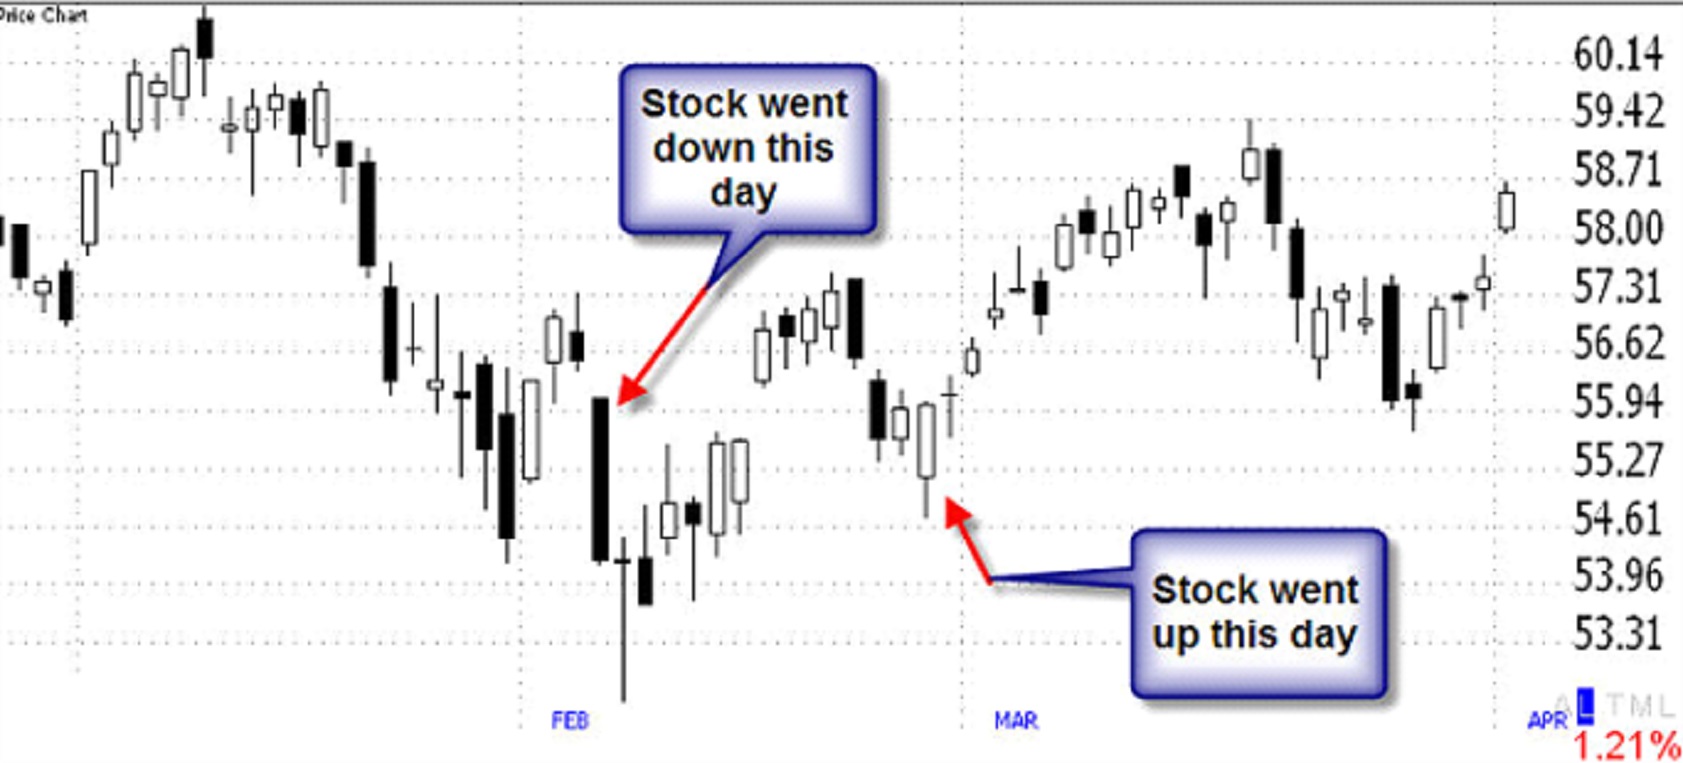
Candlestick charts have the same data as a bar chart but the “candle” is far easier to see what is going on with price. The graphical view is vastly different and far easier to read and interpret than a line or bar chart. This speeds up the analysis dramatically and eliminates common errors and mistakes that occur when you use bar charts. On down days the candles turn black, and on up days the candles are white. This immediately tells you whether the stock moved up that day or down, AND the candles show you how much it moved.
Stock Charts are your window into what is going on with a stock’s price. You may hear that a stock has gone up in price, but without being able to SEE what that really means, you have no idea whether the stock is a good buy or not. For instance, we all know that stocks move up and down in price.
Unless you study a stock chart, you will not be able to determine if that stock has been running so fast that professionals are ready to take profits which can cause the stock to fall in price due to their huge order flow.
Very long candles tell you the stock price moved several points. Small candles tell you that the stock didn’t move much.

By studying the relationship and the different kinds of candlestick patterns that form, traders can learn to reliably determine what the stock will do over the next few days to few weeks. This is why candlestick charts have become so popular so quickly. However, it is important to realize that the traditional candlestick charting was developed for the rice commodity markets in ancient Japan. Most Japanese candlestick books teach the traditional Japanese form of candlesticks. These are the ancient patterns that formed in those days.
To understand Japanese candlesticks you must first understand the culture and society under which they were created. Ancient Japan was a warlord state that also had a highly developed national passion for beauty and artistry.
Every person was expected to write poetry. They had a deep respect for nature, and artistry. Each candlestick for charting has an elegant descriptive name for its perceived role in the prices of rice. Terms such as “dark cloud”, “three rivers” all express the reverence the Japanese have for nature and beauty. Because of this love of nature and attention to detail, Japanese candlesticks have a vast number of Japanese names for every unique candle that might form. Many candlestick names also include war terms such as three soldiers, and night attack. This was due to the 200 year war between Samurai Clans that ended in a unified Japan.
Because of this love of nature and attention to detail, Japanese candlesticks have a vast number of Japanese names for every unique candle that might form. This creates a complex, hard to remember and even more difficult to use list of candlesticks that might form. TechniTrader has created a unique method of using candlesticks, simplifying the candles and identifying only those that work optimally and occur frequently in our western markets.
The Rice commodity market of ancient Japan was a very different place from the markets of the U.S. and most western markets of today. First of all, everything about the markets moves much faster today due to on-line trading, high frequency trading where orders are executed and processed by high speed computers.
Contrary to popular opinion, it is much more complex with 9 different levels of what is called “market participants” each group trades or invests for very different reasons, with different agendas and goals, experience, knowledge, and access to critical information. And there is a huge difference between the eastern and western mindset. The cultures of the east, how people think is very different than the western culture.
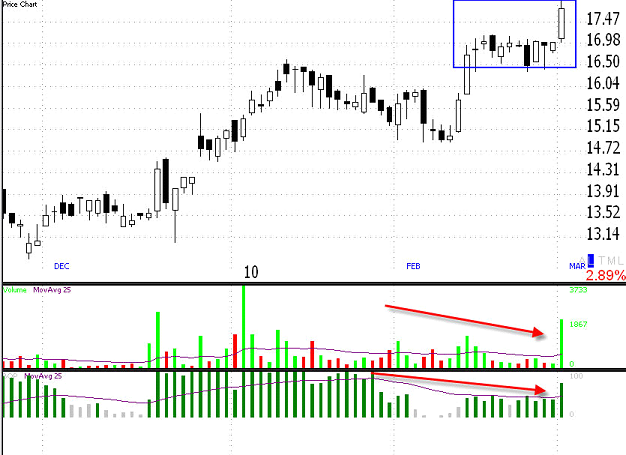
Most candlestick books do not teach buy and sell signals but tell traders to use candlesticks as a confirmation of an indicator cross-over. However since price is the most important aspect of a chart, it makes far more sense, and is far more reliable to use a candlestick pattern as the buy signal and the indicators to confirm the strength of that buy signal. In this way you can learn to do what the professional traders, market makers, and institutional traders do: use a controlled order for precision entries and exits.
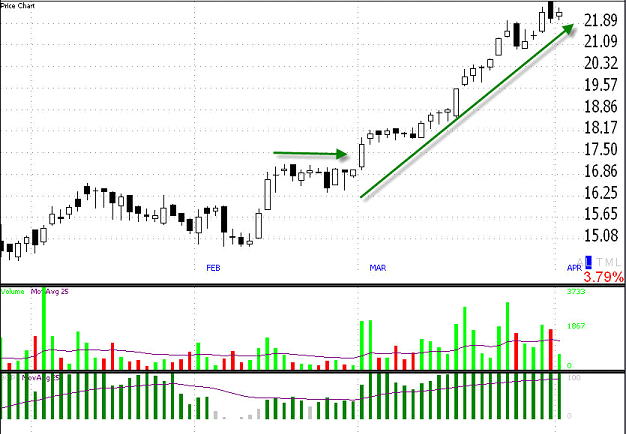
For example below is a candlestick buy signal that only TechniTrader teaches. It is called the springboard and it occurs often in lower priced stocks poised to move up quickly. It is a very reliable candlestick buy signal based on a group of candles forming in a specific way. The volume and institutional accumulation indicators—the bars below confirm there is sufficient energy and buying activity behind the price to move it up for good swing trade profits.


Most retail traders AND independent investors find reading candlestick charts to be fun and easy compared to other types of charts. Candlesticks are the only charting that can be used in all financial markets and trading instruments. Candlestick Chart Analysis Training is available from TechniTrader.com visit our website for more information.

