Stock Chart Training for Traders
Stock Charts are your window into what is going on with a stock’s price. Spatial Pattern Recognition Skills are needed if you really are serious about becoming a consistently successful trader. Regardless of your trading style: intraday, day, velocity, swing, or position trading learning how to read Charts is a critical skill.
When you can interpret a chart correctly you will be able to anticipate the direction the stock will take, how long the run will sustain, and how fast the stock will move. With this information you can determine the correct trading style to use, the strategy to use, the correct entry price, stop loss placement, and your exit strategy before you ever enter the stock. Learn chart analysis from the top educators in stock market training.
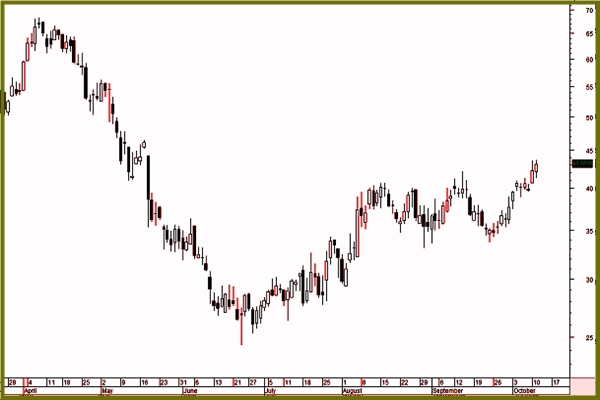
Candlestick Charts
Candlestick Charts used in modern technical analysis are derived from the ancient…
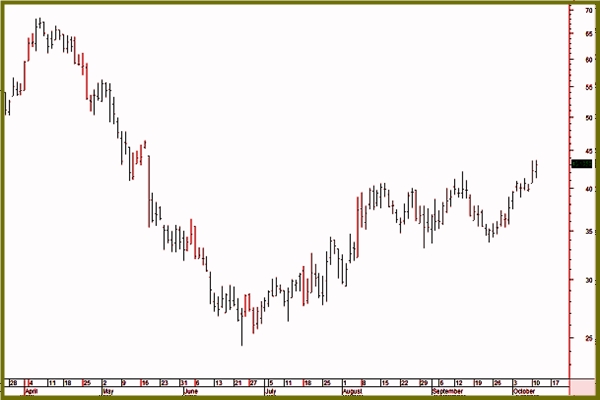
Bar Charts
The bar chart evolved out of the need of professionals who traded stocks on a short term…
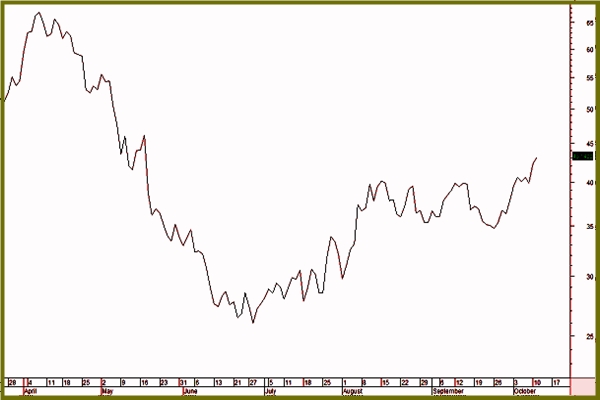
Line Charts
A Line Chart is the oldest type of stock chart and has been used for more than a century…
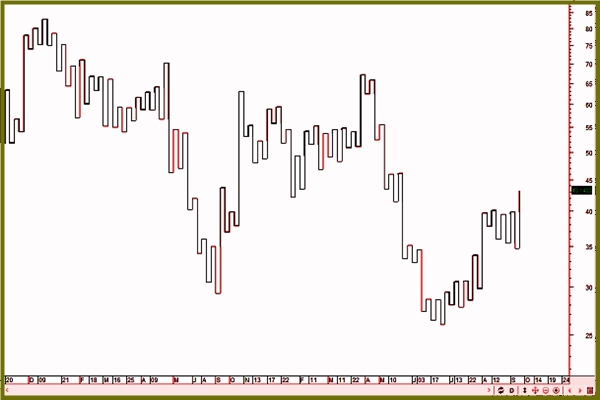
Kagi charts
The Kagi chart is a chart used for tracking price movements and to make decisions on purchasing…
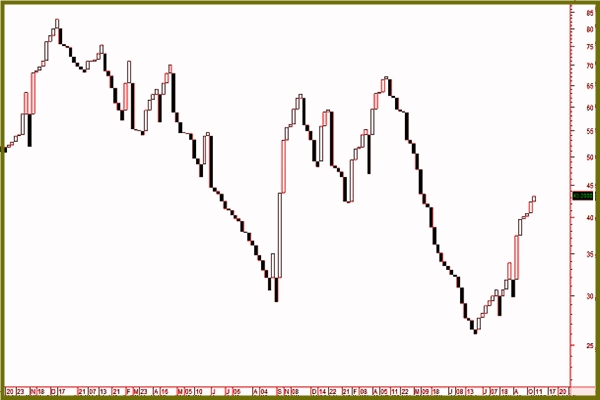
Three Line Break
Three Line Break Charts are another Japanese invention. This charting style is similar to Point…
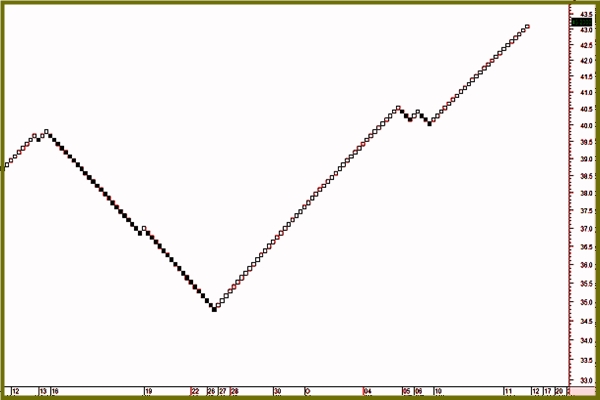
Renko Charts
Renko Charts are a Japanese Charting System similar to Point and Figure Charts but instead…
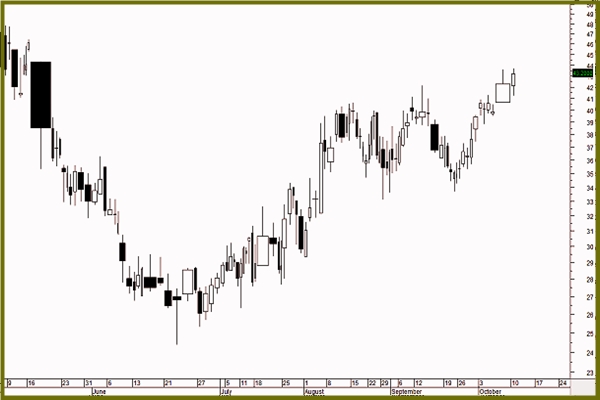
Candlevolume Charts
The Point and Figure Charts are not as popular today as they once were. Point and Figure charts…
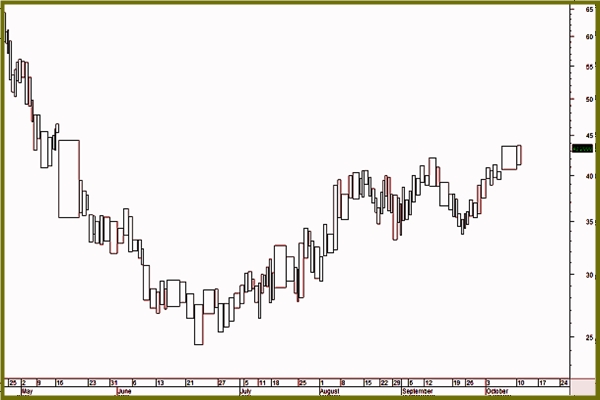
Equivolume Charts
Equivolume Charts were developed in the early 1980’s by Richard W Arms. It is important…
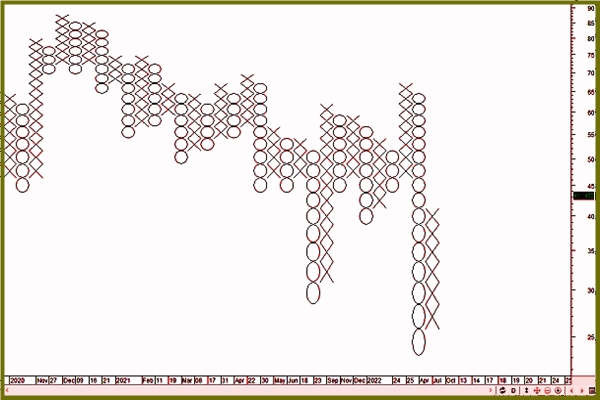
Point & Figure Charts
The Point and Figure Charts are not as popular today as they once were. Point and Figure charts…
TechniTrader Courses Instructors
Personalized Education to fit your needs and goals.
We are Professional Trading Educators and we’ve been at it for more than 20 years. Most of our students are people who tried to figure out trading on their own through free online videos, books, and weekend seminars.
They got lucky once and then lost a whole lot of money before they realized they needed a real education to make trading work for them.
Don’t make the same mistake! Let us help you learn how to avoid big losses and make more consistent income from trading or investing in stocks, ETFs or options. Start with a mini course above to experience how TechniTrader Courses can work for you.


