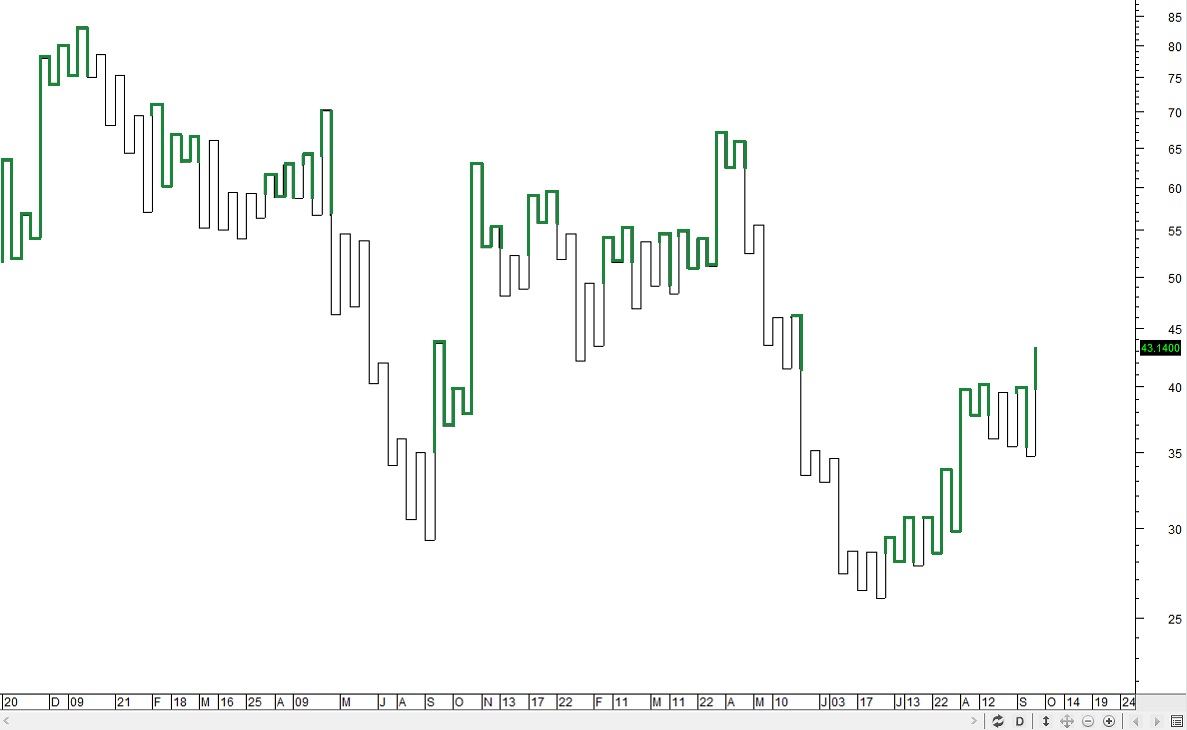
Kagi Charts
Kagi Charts are another Charting system designed by the Japanese around 1870. Kagi means key in Japanese woodblock printing. The Japanese refer to this charting as Key Charts. The charts are extremely simple in construction eliminating nearly all of the price information, with no volume information, and no details of price. The lines thicken and thin based upon how price behaves. Tops of the Kagi lines are called shoulders. Bottoms of the lines are called waists.

The Kagi line is similar to the Renko block in that the line will continue up or down until there is a significant change in price. Again Absolute Points or Average True Range is often employed as the basis for the points in a line. However percentages can also be used.
The thick lines are also called ‘yang’ and the thin lines called ‘yin’. The rule is to buy on the yang and sell on the yin. When a line begins it will only move in its column until there is a reversal point size that turns the line flat then down.
The Kagi is a simple chart however it lacks critical information most retail traders need for short term trading. It only uses one piece of data from the market: price and closing price only. The market provides Price, Time, and Quantity (aka volume and share lot size) and most traders need all of this data to properly interpret and analyze the stock for short term trading. Since there is not time on Kagi charts, it is not ideal for short term trading. Also it is prone to whipsaw action due to High Frequency trading activity.


