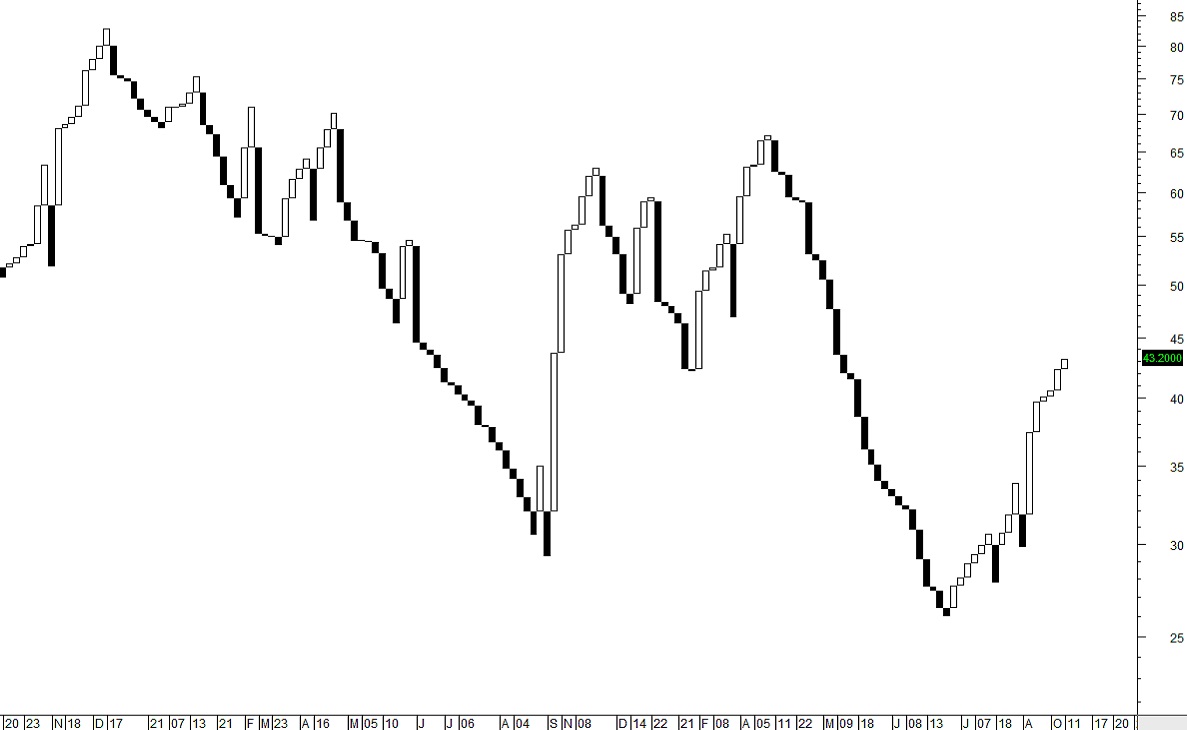
Three Line Break Charts
Three Line Break Charts are another Japanese invention. This charting style is similar to Point in Figure in that it doesn’t use time within the chart. The lines are not candles although they look similar to a candlestick chart without the wicks and tails. The Three Line Break chart is based solely on closing prices. Three line charts form only on price action not time. The goal of the charts is to filter out price action that is “noise” to expose the true trend and direction over time.

The closing price can create another white line, that moves in the same direction, or a new black line that may indicate a change of price direction, or no new line is drawn if price does not extend beyond the trend or change the trend.
Three Line Break Charts are best suited for long term analysis where an investor wishes to clarify and simplify the chart and price patterns to a basic form. Three Line Break Charts are not ideal for short term trading as they fail to provide vital information for short term trading stock picks. Interpretation of the Three Line Break Charts is similar to candlestick reversal patterns. Three line break charts are also used to clarify support and resistance and to expose trading range patterns with breakouts beyond the trading range.


