Point and Figure Charts
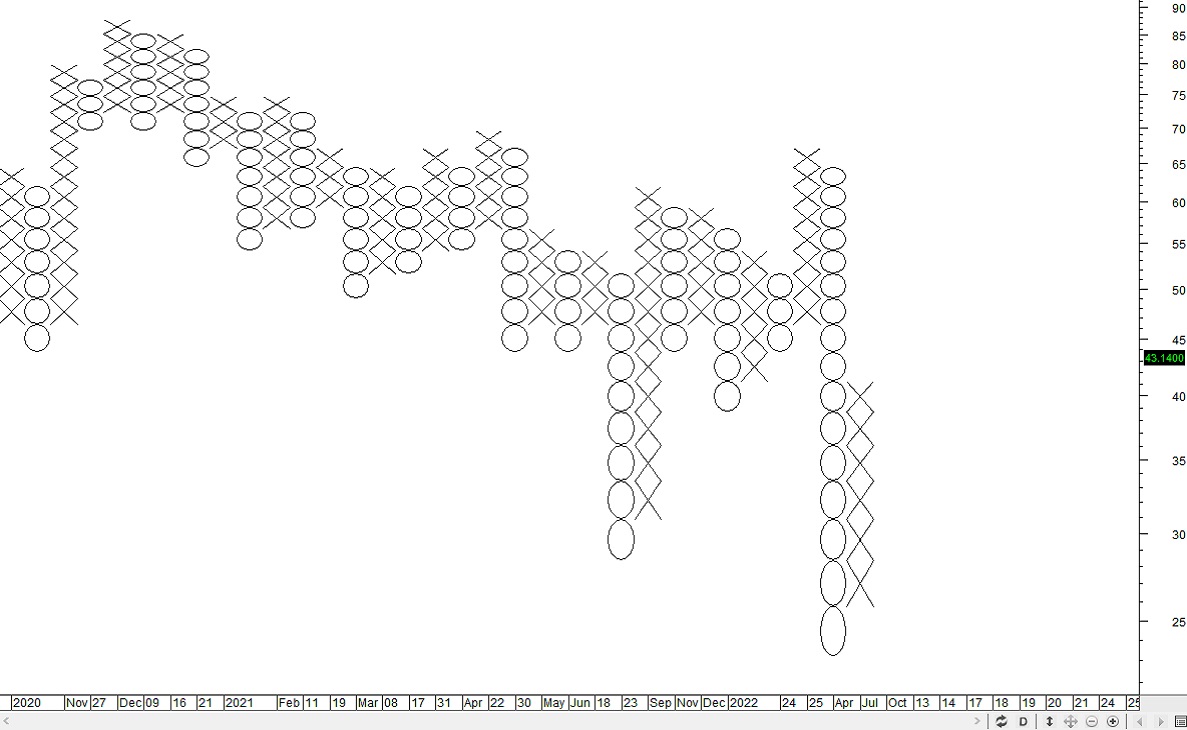
Point and Figure Charts are a very old method for tracking stock prices. Instead of a line or bar to define price, a point and figure chart is made up of X’s and 0’s. An X is put on a chart when price moves up, a 0 when price moves down. Hence a point and figure chart will look entirely different than a line, bar, or candlestick chart. X’s move upward on a vertical incremental price chart. 0’s move down on the vertical incremental price chart.

Point and Figure Charts are pure price charts which do not include the 3 piece of market data. Point and Figure only has price, it lacks time and quantity data on the chart. This can pose a serious problem for traders in an electronic marketplace. Point and Figure became popular in the late 1800’s to early 1900’s because it was a simple method for tracking a stock’s price up and down manually.
Since computer generated charts have only been around a couple of decades, point and figure offered a faster method handwriting a chart than bar charts. During the mid 20th century some chartists used point and figure while others used line or bar charts.
The benefits of point and figure before computers was:
Trendline identification:
| Was the stock trending up or down.
| Identify price based support and resistance.
| Eliminate time as a factor in price analysis.
| No use of volume or quantity.
| Focus on presumed important price action.
| Eliminate presumed unimportant price action.
Point and Figure Charts are not as popular in the modern marketplace.
There are many reasons:
Most chartists use charting software which automatically generates a chart for analysis. Using only price and not considering time and quantity hampers analysis in an electronic marketplace dominated by institutions. Point and Figure Charts were developed and designed for long term analysis. Although some attempts have been made to alter the structure for short term trading, the inherent lack of quantity and time still exist.
In the institution dominated marketplace what was once considered an insignificant price pattern aka the tight consolidation, is actually a critically important and highly significant price pattern, especially when used in conjunction with quantity indicators that reveal quiet accumulation. Candlestick Charts are far easier to use, provide far more data and information that reveals underlying patterns not expose by pure price. Many retail investors want to trade short term.
Due to the huge popularity of Candlestick charts, Line charts, and Bar charts, many charting software programs no longer offer point and figure charts. The complexity of the market structure requires more sophisticated analysis than merely price patterns. Numerous new charting tools provide many ways to define trend, identify significant price levels, support and resistance levels. This diminishes the value of point and figure charts. Stock Indicators have become far more important in analysis of short term stock picks.
Point and Figure Charts were once very popular during a time when the market had 3 levels of participants:
| Large Banks and financial institutions | Corporations and wealthy businessmen
| Small lot middle income private investors
Most chartists use charting software which automatically generates a chart for analysis. Using only price and not considering time and quantity hampers analysis in an electronic marketplace dominated by institutions. Point and Figure Charts were developed and designed for long term analysis. Although some attempts have been made to alter the structure for short term trading, the inherent lack of quantity and time still exist.
In the institution dominated marketplace what was once considered an insignificant price pattern aka the tight consolidation, is actually a critically important and highly significant price pattern, especially when used in conjunction with quantity indicators that reveal quiet accumulation. Candlestick Charts are far easier to use, provide far more data and information that reveals underlying patterns not expose by pure price. Many retail investors want to trade short term.
Due to the huge popularity of Candlestick charts, Line charts, and Bar charts, many charting software programs no longer offer point and figure charts. The complexity of the market structure requires more sophisticated analysis than merely price patterns. Numerous new charting tools provide many ways to define trend, identify significant price levels, support and resistance levels. This diminishes the value of point and figure charts. Stock Indicators have become far more important in analysis of short term stock picks.


