A Bar Chart is exactly what the name implies?
A stock chart that uses bars instead of a line to express visually how a stock price has moved during that specific period of time. Time can be one day bar, an minute bar, weekly bar, monthly bar, etc. The minimum amount of time that retail traders and investors can see on a stock chart using bar charts is one minute. Bar Charts were designed to give more information from the data that came from the market.

As the stock market evolved technical analysts wanted to use more data to make trading decisions. At first bar charts were hand written by technical analysts. Later as computers became widely used and available, vendors started writing charting software programs that automatically created the charts for traders and technical analysts. Nowadays, most all of the internet based and software based charting programs have both line and bar charts.
There are 2 kinds of Bar Charts, OHLC & HLC
The OHLC stands for:
O: Open, at what price did the stock open
H: High, what was the highest price that stock reached during that period of time.
L: Low, what was the lowest price that stock reached during that period of time.
C: Close, what was the closing price for that stock.
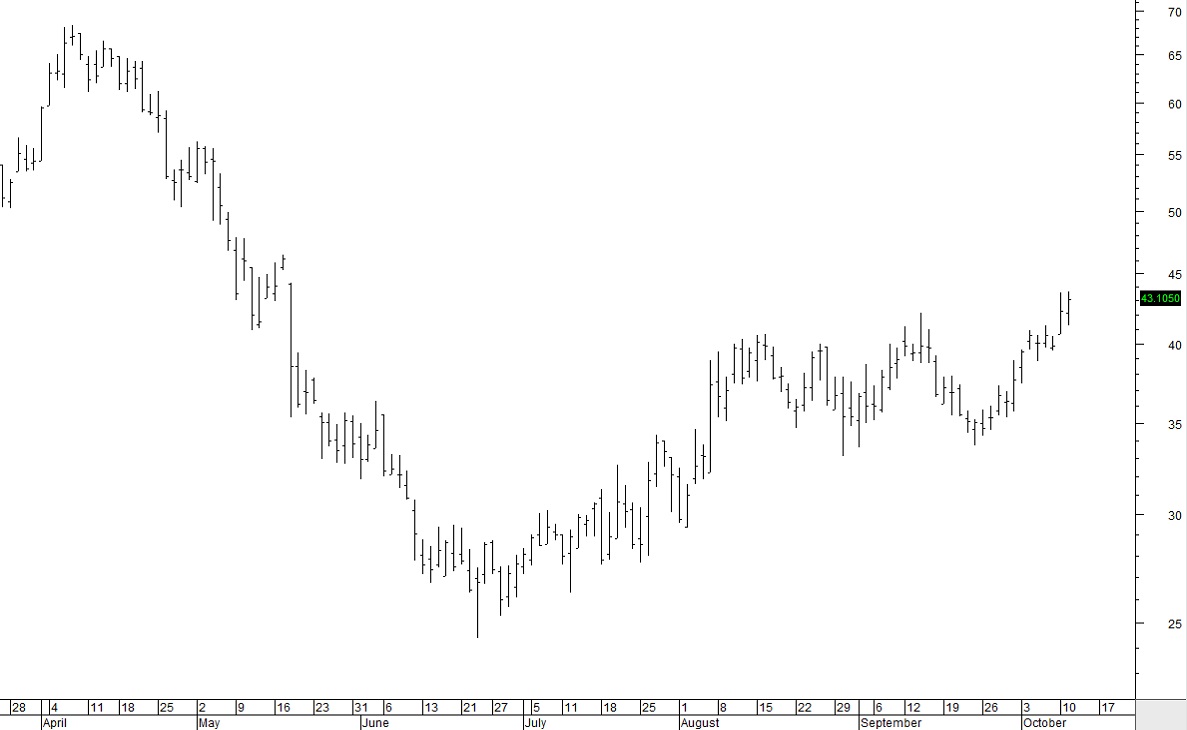
Chart #1 is the HLC type.
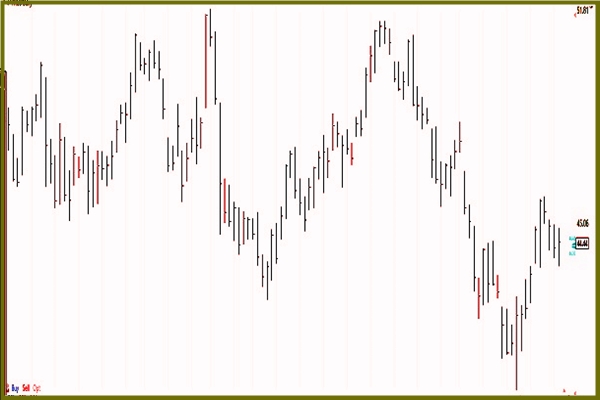
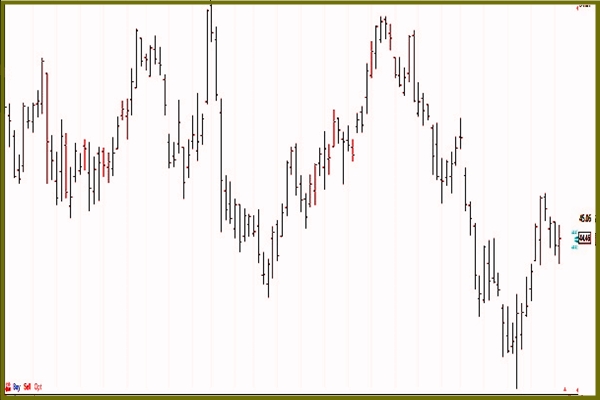
Chart #2 is the OHLC type.


Both are daily charts meaning that one entire day of trading activity is represented within one bar or vertical line. We will first study now the HLC works and what this bar chart can tell us about a stock that a line chart does not.
The HLC the vertical bar low is the low for the day, the vertical high is the high for the day. The small horizontal line indicates the close for the day. HLC is seldom used nowadays because there are far superior stock chart types. HLC was primarily the first step away from a simple Line Chart toward having more data to analyze. Since the closing price is regarded as the most important price, Bar Charts started out only showing the close. By including the closing price using a horizontal line, this helps people to “see” the line chart within the bar chart.
We can literally draw a line connecting each of the closing horizontal lines and we would see the line chart. What the HLC also provides is how MUCH the stock moved up and down during the day. The Bar Chart is superior to the line chart for shorter term stock analysis. What the Bar Chart can tell us that the Line Chart does not is how much the stock price moved that day. How much a stock moves tells us how much momentum or buying or selling pressure is occurring during that day. If the bar is very short, then the price didn’t move much and this tells us that neither buyers or sellers were pushing price up or down. Neither were in control of the price. So there was a balance between the buyers and sellers. Balance of power doesn’t last for long however.
On Chart #1 we can see that January 30,31 and February 1,2,3, (dates are at the bottom of the chart) the price didn’t move much at all. The bars are short and the stock tended to close near the high of the day just before it started moving up. Buyers seized control over sellers and started buying the stock pushing price upward.
But on February 14th the stock had a huge price range during the day but sellers took control during that day and pushed price down. The small horizontal line at the bottom of the vertical bar on February 14th tells us this fact. It is a very important piece of information because it tells us there was heavy profit taking. However the bar did not go beyond the previous lows of the bars of the past several days. So the uptrend remains intact.
The HLC Bar Chart was a significant improvement for technical analysts over the simple line chart, however as trading became more popular during the 80’s and 90’s traders needed more information. The OHLC became more popular during that time because it has 4 pieces of information instead of just 3. So now we have 4 price data per day rather than just the 1 data on a line chart. For short term traders this was a significant help to analyzing a stock chart and trading for short term gains. Being able to see where price opened told traders much more about what the stock did that day, whether it was controlled by buyers of by sellers.
The rule for reading an OHLC Bar Chart is
The HIGH of the day is represented by the highest point of the vertical line. The LOW of the day is represented by the lowest point of the vertical line. The OPEN for the day is represented by the small horizontal line on the LEFT of the vertical bar. The CLOSE for the day is represented by the small horizontal line on the RIGHT of the vertical bar. By studying the relationships between these 4 pieces of data day to day, the technical analyst can anticipate what price will do next.
Summary:
Bar Charts became popular as charting software programs developed when computers became widely used. Technical Analysis also grew and expanded beyond the exchanges, market makers, and institutions that traded the stock market. Bar Charts however are used less and less these days due to a new type of charting which is far easier to read and provides significantly better analysis faster. The Candlestick Chart is not the primary charting used by most technical analysts.


