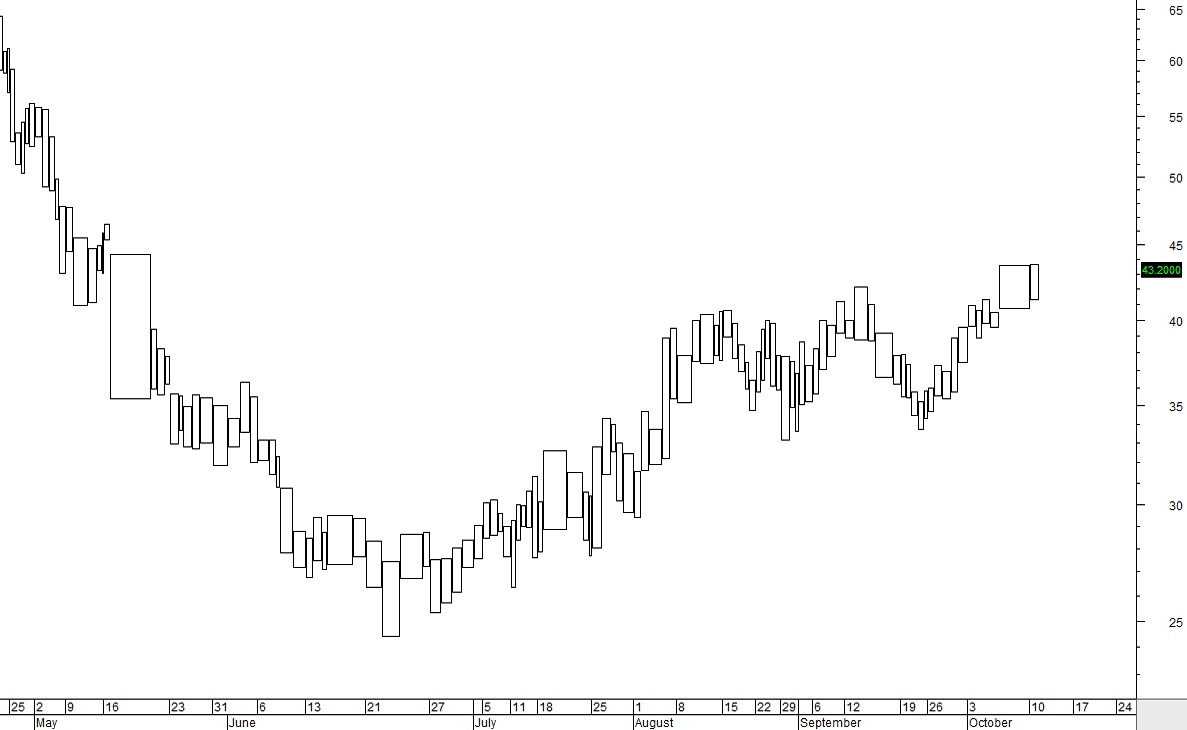
Equivolume Charts
Equivolume Charts were developed in the early 1980’s by Richard W Arms. It is important to remember that the 80’s was a very different market than we have today. There were not retail traders as there was no internet and no online brokers.
This charting program was prior to PC computers and charting programs as we know them today. At the time this charting system was created bar charts were the most popular charting and Point and Figure charts were also written mostly by hand.
Equivolume was a total departure from bar charts and Point and Figure Charts. Bar Charts represent price, usually open, high, low, and close with time.
Point and Figure Charts do not use time, only price and the direction of price.
Equivolume combines price and volume all into one graphic.
They charts resemble candlesticks to some extent however there is no open, high, low, close pricing structure within equivolume.
Equivolume was designed to expose volume patterns within the price structure. This charting was designed to provide support and resistance levels based on volume rather than price. It has been used to determine breakout patterns as volume diminishes with a sudden huge shift of volume in the opposite direction.
This type of stock chart is a specific application analysis for volume interpretation at different price levels. It is not as easy to read price patterns however which can pose problems for traders who prefer to trade stocks and options. It is best suited for financial instruments that place the most importance on volume patterns over price patterns. What equivolume charts lack is the 4 important price values for the time period.

As an example on the daily chart above, only the high and the low for the day are shown on the chart. The open and close are not available. Most stock traders believe the close and the open are more important data for the automated marketplace than the high and low which can be anomalies caused by High Frequency Trader activity.


